

- Add traces in your app.
- Record tracing data during execution.
- Analyze execution times using Perfetto’s visualization tools.
Video overview
Watch this video for an overview of using Perfetto.Add traces in your app
Using Systrace, consider adding trace point in the following areas of your code:- Functions that run frequently
- Operations that take long to execute
- Event handlers for user interactions
- Areas where you suspect performance issues
FlatList with TouchableOpacity components, add traces around the onFocus callback function.
Example:
Record app traces
After adding the necessary traces in the app JS code, rebuild your app, run it on a Vega device, and record the traces.Step 1: Rebuild your app
Rebuild your app to incorporate the performance traces into the app bundle. Make sure you use aRelease build configuration for accurate trace measurement. For build instructions, see Build Your App.
Step 2: Install and run your app
Install and run the rebuilt version of your app to begin collecting trace data. Make sure to run your app on a Vega-supported device for accurate trace measurement. For instructions on running your app on a Vega device, see Run your app on Fire TV Stick.Step 3: Record app traces
Record traces of the performance issue using:- Option 1: Vega Studio’s Activity Monitor
- Option 2: Command Line Interface a. Run the command to record a trace. b. Run the if the record command fails to work. For example, to record traces for a scrolling issue, follow these steps:
- Launch the app.
- Run Activity Monitor.
- Start recording.
- Perform scrolling within the app.
-
Stop recording.
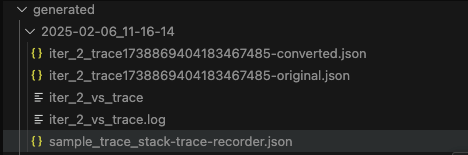
generated directory. The name of the directory shows the recording timestamp.
Activity Monitor generates the following trace files in your project directory:
Analyze app traces in Perfetto UI
After collecting traces, use Perfetto UI to analyze the duration and call patterns of your custom traces.-
Open your trace file in Perfetto UI.

- Click Open trace file.
- Select the iter*\vs\trace file from the generated directory.
- Drag the iter*\vs\trace file from the generated directory onto the Perfetto UI webpage.
- Wait for the trace to load.
-
Enter the trace name in the top search bar to find your added traces.
The following image shows a
VegaVideoApp:FocusedElement:onFocustrace added in theonFocushandler. If you have the Vega Studio extension installed, you can open trace files directly in VS Code:
- Go to your project’s generated directory in VS Code.
- Click the trace file you want to view. The file opens in the Perfetto UI within VS Code.
- Analyze the duration across all occurrences to verify expected behavior.
- Check any stacked traces to confirm the expected call pattern.
Related topics
- App Performance Best Practices
- Measure App KPIs
- Identify UI Rendering Issues
- Detect Overdraw
- Investigate Component Re-rendering Issues
