
衡量应用KPI
Vega应用关键性能指标 (KPI) 可视化工具可衡量应用的关键性能指标。这些指标包括启动时间、内存使用情况、用户界面流畅度、视频流畅度和响应能力。使用它来监控和优化应用的用户体验。通过定期跟踪这些KPI,您可以验证您的应用是否提供流畅、响应迅速的体验。在将应用发布到亚马逊应用商店之前,请衡量发布版本的性能。
了解流畅度和响应能力:
- “响应能力”衡量用户与应用交互时的反应速度。用户期望从按下按钮到看到用户界面更新期间不会出现明显延迟。
- “流畅度”(也称为“顺畅度”)衡量动画、滚动和视频播放的顺畅程度,是否存在卡顿、抖动或掉帧的情况。
本页面介绍了如何:
- 使用KPI可视化工具
- 衡量和了解应用的关键性能指标
- 设置衡量方法
- 解释结果
先决条件
在使用Vega应用KPI可视化工具之前:
-
安装Vega性能API模块:
npm install @amazon-devices/kepler-performance-api -
阅读以下部分:
- 每个KPI衡量的内容及其目标指南。参阅应用KPI指标和指南。
- 应用在不同场景中如何启动。请参阅启动场景。
- 何时设置性能标记。请参阅完全绘制的标记。
-
要衡量前台内存、视频流畅度或用户界面流畅度,请按照衡量流畅度和前台内存中的说明进行操作。
-
选择您的衡量方法:
应用KPI指标和指南
下表列出了主要KPI以及与其关联的微型KPI。主要KPI衡量整体性能指标,而微型KPI代表影响主要KPI的具体可衡量部分。
例如,应用JavaScript包加载时间是一个微型KPI,会影响总体完全绘制时间 (TTFD) KPI。空的微型KPI单元格表示没有特定子组件对该主要KPI有贡献。
| KPI | 微型KPI | 单位 | 启动场景 | 描述 | 指南 |
|---|---|---|---|---|---|
第一帧时间 (TTFF) |
秒 (s) | 应用冷启动 | 衡量从应用启动到第一帧渲染的时间。操作系统 (OS) 无需利用应用代码标记即可计算TTFF。 | < 1.5秒 | |
TTFF |
秒 (s) | 应用热启动 | 衡量应用从后台切换到前台所需的时间。操作系统无需利用应用代码标记即可计算TTFF。 | < 0.5秒 | |
TTFD |
秒 (s) | 应用冷启动 | 衡量应用从启动到应用准备好进行用户交互所需的时间。您必须确定应用何时完全绘制。请参阅完全绘制的标记。 | < 8.0秒 | |
TTFD |
应用程序JavaScript包加载时间 |
秒 (s) | 应用冷启动 | 衡量应用初始化期间加载JavaScript包所需的时间。 | 不适用 |
TTFD |
网络调用时间 |
秒 (s) | 应用冷启动 | 衡量应用初始化期间完成所有网络调用所需的时间。此衡量考虑了并行请求。它表示所有调用解析之前的总持续时间。 | 不适用 |
TTFD |
秒 (s) | 应用热启动 | 衡量应用从后台移动到前台后变得可以完全交互所需的时间。当应用状态更改为前台时,必须调用完全绘制的回调。请参阅完全绘制的标记。 | < 1.5秒 | |
前台内存 |
MebiBytes (MiB) | 在前台中的应用 | 衡量应用激活时按比例分配共享库占用的内存 (PSS)。PSS反映了在RAM中拥有的私有内存和共享内存的比例份额。Vega应用KPI可视化工具可衡量各个阶段的此指标,包括启动时、前台过渡时和执行占用大量内存资源的操作时。 | < 400MiB | |
后台内存 |
MebiBytes (MiB) | 在后台中的应用 | 衡量在启动并移至后台后应用的PSS。该指标可捕获应用处于非活动状态但可以快速恢复时的内存占用量。 | < 150MiB | |
视频流畅度 |
百分比 (%) | 视频播放 | 衡量视频以预期帧速率播放的时间百分比。值越高表示播放越流畅。 | > 99% | |
第一个视频帧显示的时间 (TTFVF) |
毫秒 (ms) | 视频播放 | 衡量从视频播放开始到第一个视频帧显示的时间。prep成员中的最后一次用户界面交互会触发视频播放。有关详细信息,请参见衡量流畅度和前台内存。 |
< 2500毫秒 | |
TTFVF |
播放器开始播放所需的时间 | 毫秒 (ms) | 视频播放 | 衡量创建媒体播放器实例所需的时间。仅适用于VegaScript项目中的Vega媒体播放器。 | < 2500毫秒 |
TTFVF |
播放器开始播放到第一个视频帧显示 | 毫秒 (ms) | 视频播放 | 衡量媒体播放器实例创建后第一个视频帧出现所需的时间。仅适用于VegaScript项目中的Vega媒体播放器。 | < 2500毫秒 |
视频连续丢帧3帧以上 |
数量 | 视频播放 | 统计应用在播放过程中连续丢弃三个或更多视频帧从而导致视频流媒体质量上存在明显中断的实例。 | 不适用 | |
视频连续丢帧5帧以上 |
数量 | 视频播放 | 统计应用在视频播放期间连续丢失五帧或更多帧的情况,这表明播放出现严重中断。 | 不适用 | |
按键延迟 |
毫秒 (ms) | 视频播放 | 衡量从用户界面线程上的按键输入事件到其JavaScript回调调用所经过的时间。 | < 100毫秒 | |
按键释放延迟 |
毫秒 (ms) | 视频播放 | 衡量从按键释放输入事件到其相应的JavaScript回调调用的时间。 | < 100毫秒 | |
用户界面流畅度 |
百分比 (%) | 用户界面交互(例如,垂直和水平滚动) | 衡量应用在屏幕用户界面交互(例如滚动和导航)期间成功渲染的帧的百分比。 | > 99% | |
应用事件响应时间 - 焦点 |
毫秒 (ms) | 用户界面交互(例如,垂直和水平滚动) | 衡量焦点事件 (onFocus/onBlur) 的原生用户界面线程和JavaScript线程之间的调度延迟。延迟超过200毫秒表示JavaScript线程拥塞。 | < 200毫秒 | |
连续丢帧3帧以上 |
数量 | 用户界面交互(例如,垂直和水平滚动) | 统计应用在滚动期间连续丢失三帧或更多帧从而导致用户界面出现明显卡顿的情况。 | 不适用 | |
连续丢帧5帧以上 |
数量 | 用户界面交互(例如,垂直和水平滚动) | 统计应用在滚动期间连续丢失五帧或更多帧从而导致用户界面出现明显卡顿的情况。 | 不适用 | |
连续5个以上的延迟事件 - 焦点 |
数量 | 用户界面交互(例如,垂直和水平滚动) | 统计应用连续经历五次或更多延迟焦点事件,导致导航响应能力明显不佳的实例。 | 不适用 |
启动场景
KPI可视化工具可衡量两种类型的应用启动场景,以评估TTFF和TTFD性能:
-
冷启动 - 指用户首次启动应用,并且系统会将所有资源和依赖项加载到内存中。
-
热启动 - 指用户将应用从后台(非活动状态)切换到前台(活动状态),并且内存中已有一些资源和依赖项。
完全绘制的标记
当您的应用变得可用于用户交互时,完全绘制的标记会发出信号。标记:
- 表示您的应用何时完成其主要组件的加载。
- 标记用户何时可以开始与您的应用进行交互。
- 帮助衡量TTFD性能。
要在应用中实现完全绘制的标记,请执行以下操作:
- 将
useReportFullyDrawn挂钩添加到您的应用。 - 在以下关键点放置标记:
- Cool start(冷启动)- 在加载初始数据并渲染主屏幕之后。
- Warm start(热启动)- 当您的应用在前台运行后变得响应迅速时。
以下代码示例显示了如何添加完全绘制的标记:
import { useReportFullyDrawn } from '@amazon-devices/kepler-performance-api';
import React, { useCallback, useEffect, useState } from 'react';
import { useKeplerAppStateManager } from '@amazon-devices/react-native-kepler';
...
...
export const App = () => {
  const reportFullyDrawnCallback = useReportFullyDrawn();
  const KeplerAppStateManager = useKeplerAppStateManager();
  const [appState, setAppState] = useState(KeplerAppStateManager.getCurrentState());

  // 使用useEffect挂钩,在首次呈现后以及
  // 在冷启动后发布第一次渲染。

  // 如果应用执行额外的异步处理,
  // 并在完全绘制之前需要完成这些处理,
  // 则在依赖项数组中传递完成状态,
  // 并检查挂钩内部的状态。
  useEffect(() => {
    reportFullyDrawnCallback();
  }, [reportFullyDrawnCallback]);

  // 在热启动后的第一次绘制时发出完全绘制标记。
  const handleAppStateChange = useCallback((stateChange: any) => {
    if (

	 appState.match(/^(inactive|background)$/) &&
	 stateChange === 'active'
	) {
	  reportFullyDrawnCallback();
	}
	if (stateChange.match(/^(inactive|background|active|unknown)$/)) {
	  setAppState(stateChange)
	}
  }, [appState, reportFullyDrawnCallback]);

  useEffect(() => {
    const changeSubscription = KeplerAppStateManager.addAppStateListener(
	  'change',
	  handleAppStateChange,
    );
    return () => {
	  changeSubscription.remove();
	}
  }, [handleAppStateChange]);
  ...
  ...
  return (
    <View style={styles.container}>
      ...
      ...
    </View>
  );
};
在VS Code中衡量KPI
步骤1: 在VS Code中打开命令面板
- 对于 Mac: Shift+Command ⌘+P
- 对于Linux, Ctrl+Shift+P

步骤2: 输入Vega: Launch App KPI Visualizer
步骤3: 按Enter

您也可以选择Vega Studio面板中的App KPI Visualizer。
步骤4: 选择用例

要衡量前台内存和视频播放流畅度,请创建与用户与应用交互方式相匹配的自定义测试场景。
例如:
- 对于内存测试 - 包括视频播放或图像加载
- 对于视频播放 - 包括典型的视频观看模式
要衡量用户界面流畅度,请开发一个测试场景,以重现应用中最常见的用户交互情况。如果没有自定义场景,默认测试会滚动浏览应用的首页。这可能无法准确代表用户的行为。
有关生成测试场景的指导,请参见衡量流畅度和前台内存。
选择用例后,可视化工具将启动并针对以下KPI执行三次迭代。
冷启动KPI
- 在设备上启动测试应用。
- 等待10秒钟让测试应用加载。
- 关闭测试应用
- 处理KPI
热启动KPI
- 在设备上启动测试应用
- 在设备上启动另一个应用,将测试应用移至后台
- 启动测试应用,将其移至前台。
- 等待15秒钟让测试应用加载。
- 关闭测试应用
- 处理KPI
前台内存KPI
- 在设备上启动测试应用。
- 在测试场景中执行指定的步骤。
- 捕获KPI以进行分析和报告。
- 关闭测试应用
- 处理KPI
后台内存KPI
- 在设备上启动测试应用。
- 在设备上启动另一个应用,将测试应用移至后台。
- 等待15秒钟以收集测试应用的KPI。
- 关闭测试应用
- 处理KPI
用户界面流畅度KPI
- 在设备上启动测试应用。
- 选择测试方法:
- 自定义测试 - 使用您自己的用户界面交互场景
- 默认测试 - 使用标准滚动模式
- 两组水平滚动(向左五个,向右五个)
- 两组垂直滚动(向下五个,向上五个)
- 操作间隔900毫秒
-
选择Cancel(取消)或按Esc结束测试。

- 捕获KPI以进行分析和报告。
- 关闭测试应用
- 处理KPI

预定义的测试会滚动浏览您的应用的主页,这可能不代表应用的使用模式。创建可以反映特定应用用户界面交互情况的自定义测试场景。
视频播放流畅度KPI
- 在设备上启动测试应用。
- 执行视频播放测试场景中的步骤。
- 捕获KPI以进行分析和报告。
- 关闭测试应用
- 处理KPI。
要停止可视化进程,请选择Cancel。

步骤5: 选择在测试期间是否忽略跟踪丢失问题

当您的应用出现性能问题时,可能会发生严重的跟踪丢失问题。Vega应用KPI可视化工具不会加载跟踪,并在报告中将KPI显示为N/A。
在生成KPI报告以查看指标时,您可以选择忽略跟踪丢失问题。但是,忽略跟踪丢失问题会导致生成的KPI值似乎要优于实际性能。
步骤6: 在可视化工具窗口中查看KPI分数
该窗口显示通过三次测试迭代计算得出的P90(第90个百分位数)值。
步骤7: 评估结果
要评估结果,请参阅了解性能报告。
使用CLI命令衡量KPI
步骤1: 检查设备就绪情况
在命令提示符下,运行vega exec perf doctor命令以检查主机和目标设备是否已准备就绪。
vega exec perf doctor [--app-name]
将--app-name替换为manifest.toml文件中的程序包ID。当多个设备运行时,指定设备序列号。在perf命令中使用--device-serial-number参数。
仅连接单台设备的示例:
# 单台设备
vega exec perf doctor --app-name=com.amazondeveloper.keplervideoapp.main

Firmware: Stable build (<device-user> OS 1.1 (TV Mainline/1387)).
✅ Network: Connected
✅ Free disk space: 43.31 GB available.
✅ Appium: Installed (version 2.2.2)
✅ Appium driver for Vega: Installed - kepler@3.18.0 [installed (linked from /Users/.../AppiumVegaDriver)]
✅ com.amazondeveloper.keplervideoapp.main is installed.

Collecting CPU (4 cores) and Memory data...
❌ Max User CPU usage at 241.20%.Check for unwanted processes.
❌ Max System CPU usage at 222.80%.Check for unwanted processes.
✅ Average User CPU usage at 166.16%
✅ Average System CPU usage at 101.84%
✅ Min memory available at 30.80%
✅ Average memory available at 32.16%

! Device: Not ready for performance testing.Please review lines with X (error) and ! (warnings) symbols.
多台设备连接示例:
# 多台设备
vega exec perf doctor --app-name=com.amazondeveloper.keplervideoapp.main --device-serial-number=G000XX1234567890
步骤2: 启动Vega应用KPI可视化工具
vega exec perf kpi-visualizer --app-name=[应用名称]
对于kpi-visualizer来说,应用名称是唯一一个必需要有的参数。将[应用名称]替换为manifest.toml文件中默认交互组件的ID。
步骤3: (可选)指定迭代次数。
默认迭代次数:三次,或者如果使用了--certification,则为30次。
--iteration [次数]
步骤4: (可选)指定要衡量的KPI
--kpi [KPI名称]
如果没有此参数,可视化工具会默认衡量冷启动TTFF和TTFD KPI。
步骤5: 查看所有可用选项
kpi-visualizer --help
示例:
vega exec perf kpi-visualizer --help

    名称:

    KPI可视化工具

    描述:

    衡量应用启动时间、内存使用量和用户界面响应能力等关键性能指标,以优化应用的用户体验。

    概要:

    vega exec perf kpi-visualizer [参数]

    使用“vega exec perf command --help”检索特定命令的信息。

    参数:

    --iterations ITERATIONS
          设置运行测试的次数。这会覆盖.conf设置。
    --record-cpu-profiling
          在测试执行期间启用CPU配置文件记录。
    --sourcemap-file-path SOURCEMAP_FILE_PATH
          指定源映射文件的路径。
    --grpc-port port
          指定gRPC服务器的端口号。
    --certification
          使用30次迭代和第90个百分位聚合在认证模式下运行测试。
    --expected-video-fps EXPECTED_VIDEO_FPS
          为受测应用指定目标FPS。
    --kpi KPI
          (可选)指定要衡量的性能指标。

          支持的场景:
          1. 冷启动延迟 - 衡量应用冷启动时的启动延迟。默认情况下包括TTFF和TTFD。
          2. 用户界面流畅度 - 衡量用户界面交互的流畅度。
          3. 热启动延迟 - 衡量将应用程序从后台恢复到前台时的第一帧显示延迟。
          4. 前台内存 - 衡量应用处于前台状态时的内存使用情况。
          5. 后台内存 - 衡量应用处于后台状态时的内存使用情况。
          6. 视频流畅度 - 衡量视频播放的流畅度。需要启动视频播放的测试场景 (--test-scenario)。

    --test-scenario TEST_SCENARIO
          指定定义用户界面测试场景的Python脚本。使用generate-test-template命令创建测试场景模板。

    --monitor-processes MONITOR_PROCESSES [MONITOR_PROCESSES ...]
          指定测试期间要监控的其他服务。

          示例:
          --monitor-processes webview.renderer_service

    --ignore-trace-loss
          测试期间跳过跟踪数据丢失验证。

    --help
          显示此帮助消息。

    --version, -v
          显示此perf工具的当前版本。
    %
可视化完成后,您将在stdout中看到报告摘要。
示例报告:
Performance Analyzer KPI Report

固件版本: 设备操作系统 <版本> (VegaMainlineTvIntegration/XXXX),序列号: XXXXXXXXXXXXXXXX
Date: 01/09/2025, test: app-background, iterations requested: 3, iterations completed: 3, duration: 15 seconds

Memory Statistics
                            | n   | min    | mean    | max    | stdev  | ci (+/-)
App Resident Memory (kB)    | 104 | 131044 | 132139.0| 133136 | 865.2  | 140.8 √
当KPI显示-1时,表示平均值、最小值和最大值的数据不可用。对于TTFD,当应用未调用“报告完全绘制的API”时,可能会发生这种情况。
如果KPI未显示,则表示在数据收集过程中可能会出现严重的跟踪丢失问题。KPI可视化工具不加载跟踪,也不显示KPI。要在出现跟踪丢失问题的情况下查看KPI,请运行:
--ignore-trace-loss <true/false>
了解性能报告
Vega应用KPI可视化工具会显示性能报告,其中包括:
-
Test information(测试信息)
- Date(日期)- 系统捕获KPI数据的日期
- Device Serial ID(设备序列号)- 运行应用的设备的唯一标识符
- App(应用)- 显示KPI数据的应用的名称
- Number of iterations(迭代次数)- 执行KPI衡量进程的次数
-
KPI Name(KPI名称)- 带单位的KPI的名称
-
Test Name(测试名称)- 测试或已完成用例的名称
-
KPI Health(KPI健康状况)- 代表每个KPI健康状况的颜色编码系统:
- 🟢(绿色)- 表示在建议值范围内。
- 🟡(黄色)- 表示超过建议值10%以内。
- 🔴(红色)- 表示超过建议值10%以上。
-
KPI Score(KPI分数)- KPI的数值,以KPI名称中指定的单位显示。如果可视化工具无法计算KPI,则会显示KPI分数为“N/A”(不适用),并将KPI Health列为“Unknown”(未知)。
-
Guideline(指南)- 基于行业标准或性能目标提供的KPI分数建议值或范围。
结果示例
下图显示了每个用例的结果示例。请注意与指南相关的KPI Health指标和分数。
用例:冷启动TTFF和TTFD
以下结果显示了启动性能指标。红色指示器表示应用超过了启动时间指导值。

用例:热启动TTFF和TTFD
以下结果表示应用如何从后台状态恢复。比较TTFF和TTFD时间以评估优化需求。

用例:前台内存
以下结果显示了您的应用在活跃使用期间的内存使用情况。监控此指标,以防因内存消耗过多而导致性能问题。

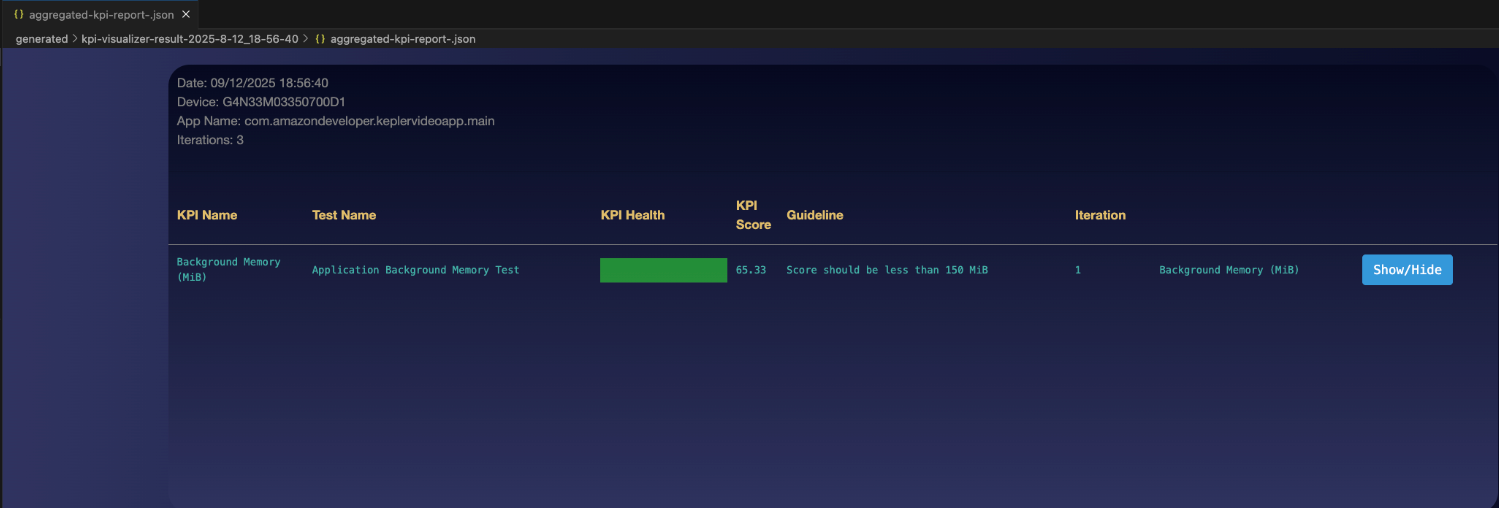
用例:后台内存
以下结果显示了您的应用在后台状态下的内存占用量。了解应用处于非活动状态时对系统资源的影响有助于优化后台行为。
用例: 用户界面流畅度
以下结果显示了您的应用处理用户交互的顺畅程度。该百分比表示在滚动和导航期间成功渲染的帧。

用例:视频播放流畅度
以下结果显示了您的应用播放视频内容的顺畅程度。该百分比表示以预期播放速率成功传输的帧。此场景还包括媒体播放器和输入事件微型KPI。

打开KPI报告
Vega应用KPI可视化工具在完成测试场景后会生成以下报告文件:
-
aggregated-kpi-report-[时间戳].json - 整合来自所有测试场景的KPI数据
-
[测试名称]-kpi-report-[时间戳].json - 为每个单独的测试场景创建一个文件[测试名称] 用于标识特定场景
[时间戳] 表示Vega应用KPI可视化工具生成报告的时间。
要打开KPI报告,请打开之前的记录。然后使用以下方法之一:
选项1(首选): 使用快速打开
此方法可通过VS Code的界面或CLI访问您的记录。
在VS Code中
-
使用VS Code快速打开或在项目的
generated目录中查找KPI报告文件(例如:app-launch-kpi-report-[时间戳].json)。 -
选择文件一次进行预览,或单击两次以活动模式打开。
在CLI中
-
打开终端窗口并输入:
code <<记录文件路径>>如果您的终端无法识别
code命令,请打开VS Code命令面板(使用Mac时按Cmd+Shift+P,使用Linux时按Ctrl+Shift+P)。 - 选择Shell Command: Install code command in PATH(Shell命令:在PATH中安装code命令)。
- 重试该命令。
选项2: 使用VS Code命令面板
此方法可让您使用VS Code的内置命令界面或在快速打开不可用时访问您的记录。
- 打开VS Code。
- 打开命令面板(使用Mac时按Cmd+Shift+P,使用Linux时按Ctrl+Shift+P)。
- 输入Vega: Open Recording View(Vega:打开记录视图)。
- 选择要打开的文件,例如
app-launch-kpi-report-[时间戳].json。
相关主题
Last updated: 2026年5月6日
