

Video overview
Watch this video for an overview of using Perfetto.Add traces in your app
Using Systrace, consider adding trace points in the following areas of your code:- Functions that run frequently
- Operations that take a long time to execute
- Event handlers for user interactions
- Areas where you suspect performance issues
Tracing focus performance
When investigating slow focus behavior while scrolling aFlatList with TouchableOpacity components, add traces around the onFocus callback function.
Example:
Record app traces
After adding traces in your app’s JavaScript code, rebuild and run your app on a Vega device. Then record the traces.Step 1: Rebuild your app
Rebuild your app to incorporate the performance traces into the app bundle. Use aRelease build configuration for accurate trace measurement. For build instructions, see Build Your App.
Step 2: Install and run your app
Install and run the rebuilt version of your app on a Vega-supported device. For instructions, see Run your app on Fire TV Stick.Step 3: Record app traces
Record traces of the performance issue using:- Option 1: Vega Studio’s Activity Monitor
- Option 2: Command Line Interface a. Run the command to record a trace. b. Run the if the record command fails to work. For example, to record traces for a scrolling issue, follow these steps:
- Launch the app.
- Run Activity Monitor.
- Start recording.
- Perform scrolling within the app.
-
Stop recording.
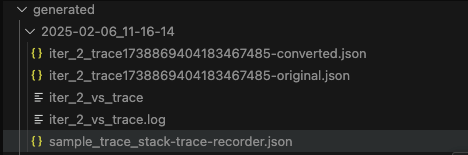
generated directory. The name of the directory shows the recording timestamp.
Activity Monitor generates the following trace files in your project directory:
Analyze app traces in Perfetto UI
After collecting traces, use Perfetto UI to analyze the duration and call patterns of your custom traces.-
Open your trace file in Perfetto UI.

- Choose Open trace file.
- Select the iter*\vs\trace file from the generated directory, or drag it onto the Perfetto UI webpage.
- Wait for the trace to load.
-
Enter the trace name in the top search bar to find your added traces.
The following image shows a
VegaVideoApp:FocusedElement:onFocustrace added in theonFocushandler. If you have the Vega Studio extension installed, you can open trace files directly in VS Code:
- Go to your project’s generated directory in VS Code.
- Choose the trace file you want to view. The file opens in the Perfetto UI within VS Code.
- Analyze the duration across all occurrences to verify expected behavior.
- Check any stacked traces to confirm the expected call pattern.
Analyze performance patterns in Perfetto
Beyond inspecting individual traces, Perfetto helps you identify broader performance patterns that impact fluidity and responsiveness. The following subsections walk through common analysis techniques.Analyze event processing time
TheUIManagerBinding::dispatchEvent slice shows how long each UI event takes to process on the JS thread. Each slice has a debug.type argument that identifies the event type. For focus and blur analysis, look for slices where debug.type is topFocus or topBlur.
Long event durations indicate blocking work in your event handlers.
To analyze event processing time:
- In Perfetto UI, search for
UIManagerBinding::dispatchEventin the search bar. - Choose a slice to view its details.
- In the details panel, check the
debug.typeargument to identify the event type (for example,topFocus,topBlur,topLoad). - Review the duration of focus and blur event slices. These events should complete well under 16ms.
- Look for patterns in the event durations. For example, if
topFocusevents consistently take 50ms, this points to blocking work inside youronFocushandler.
In this example, focus events taking 50–52ms directly correspond to synchronous blocking work in the focus handler. Blur events at ~22ms indicate similar blocking work in the blur handler.
To generate these metrics from your own trace, run the following SQL query in Perfetto’s query editor (Query (SQL) tab):
UIManagerBinding::dispatchEvent slices by their debug.type (for example, topFocus, topBlur, topLoad) and calculates the count, average, minimum, and maximum duration for each type.
For a visual walkthrough of navigating traces in Perfetto, see the animation in Analyze frame timing.
Analyze frame timing
For fluidity issues, examine theframe slices to identify dropped frames during navigation or scrolling.
The following animation shows how to find long frames in Perfetto UI:
 To analyze frame timing:
- Find the
frametrack under your app’s process in Perfetto UI. - Identify frames that exceed 16.67ms (the budget for 60fps rendering). Long frames appear as wider bars in the timeline.
- Zoom in on areas where frames are longer than expected.
A frame taking 62.94ms means the app dropped approximately four frames (62.94ms / 16.67ms ≈ 4). This data correlates with the “5+ Consecutive Dropped Frames” KPI from the KPI Visualizer. For more on fluidity metrics, see Measure App KPIs. To investigate UI rendering issues, see Identify UI Rendering Issues.
To generate a frame timing summary from your own trace, run the following SQL query in Perfetto’s query editor (Query (SQL) tab):
Correlate JS work with frame drops
The key insight from Perfetto analysis is the correlation between JS thread blocking and frame drops. When the JS thread is busy with synchronous work, both fluidity and responsiveness suffer. For a visual reference, see the animation in Analyze frame timing. A typical sequence looks like this:- User presses a D-pad button (for example, RIGHT).
- The
onFocushandler is called on the newly focused element.- Blocking work (such as a synchronous data check) holds the JS thread.
- Non-native animations add more JS thread work.
- During this time, multiple frames can’t be rendered.
- The user sees stuttering and delayed focus movement.
- Find a region with dropped frames in the
frametrack. - Check the JS thread activity near the frame track during the same time window.
- Check if long
UIManagerBinding::dispatchEventslices overlap with the dropped frames.
Related topics
- App Performance Best Practices
- Measure App KPIs
- Identify UI Rendering Issues
- Detect Overdraw
- Investigate Component Re-rendering Issues
