

- Crashes: Your app stopped unexpectedly.
- App Not Responding (ANR) events: Your app stopped responding to user input.
- Low-memory kills (LMK): The system stopped your app to free up memory.
Before you begin
For the requirements to use App Health Insights, and for steps to open it from the Developer Console, see App Health Insights Dashboard. To open the App Stability dashboard- Open App Health Insights for your app.
- In the sidebar, select Stability.
Dashboard overview
The App Stability dashboard has three tabs: Crash, ANR, and LMK. Each tab shows key performance indicator (KPI) cards, a trend graph, and breakdowns by dimension. The Crash and ANR tabs also list individual issues.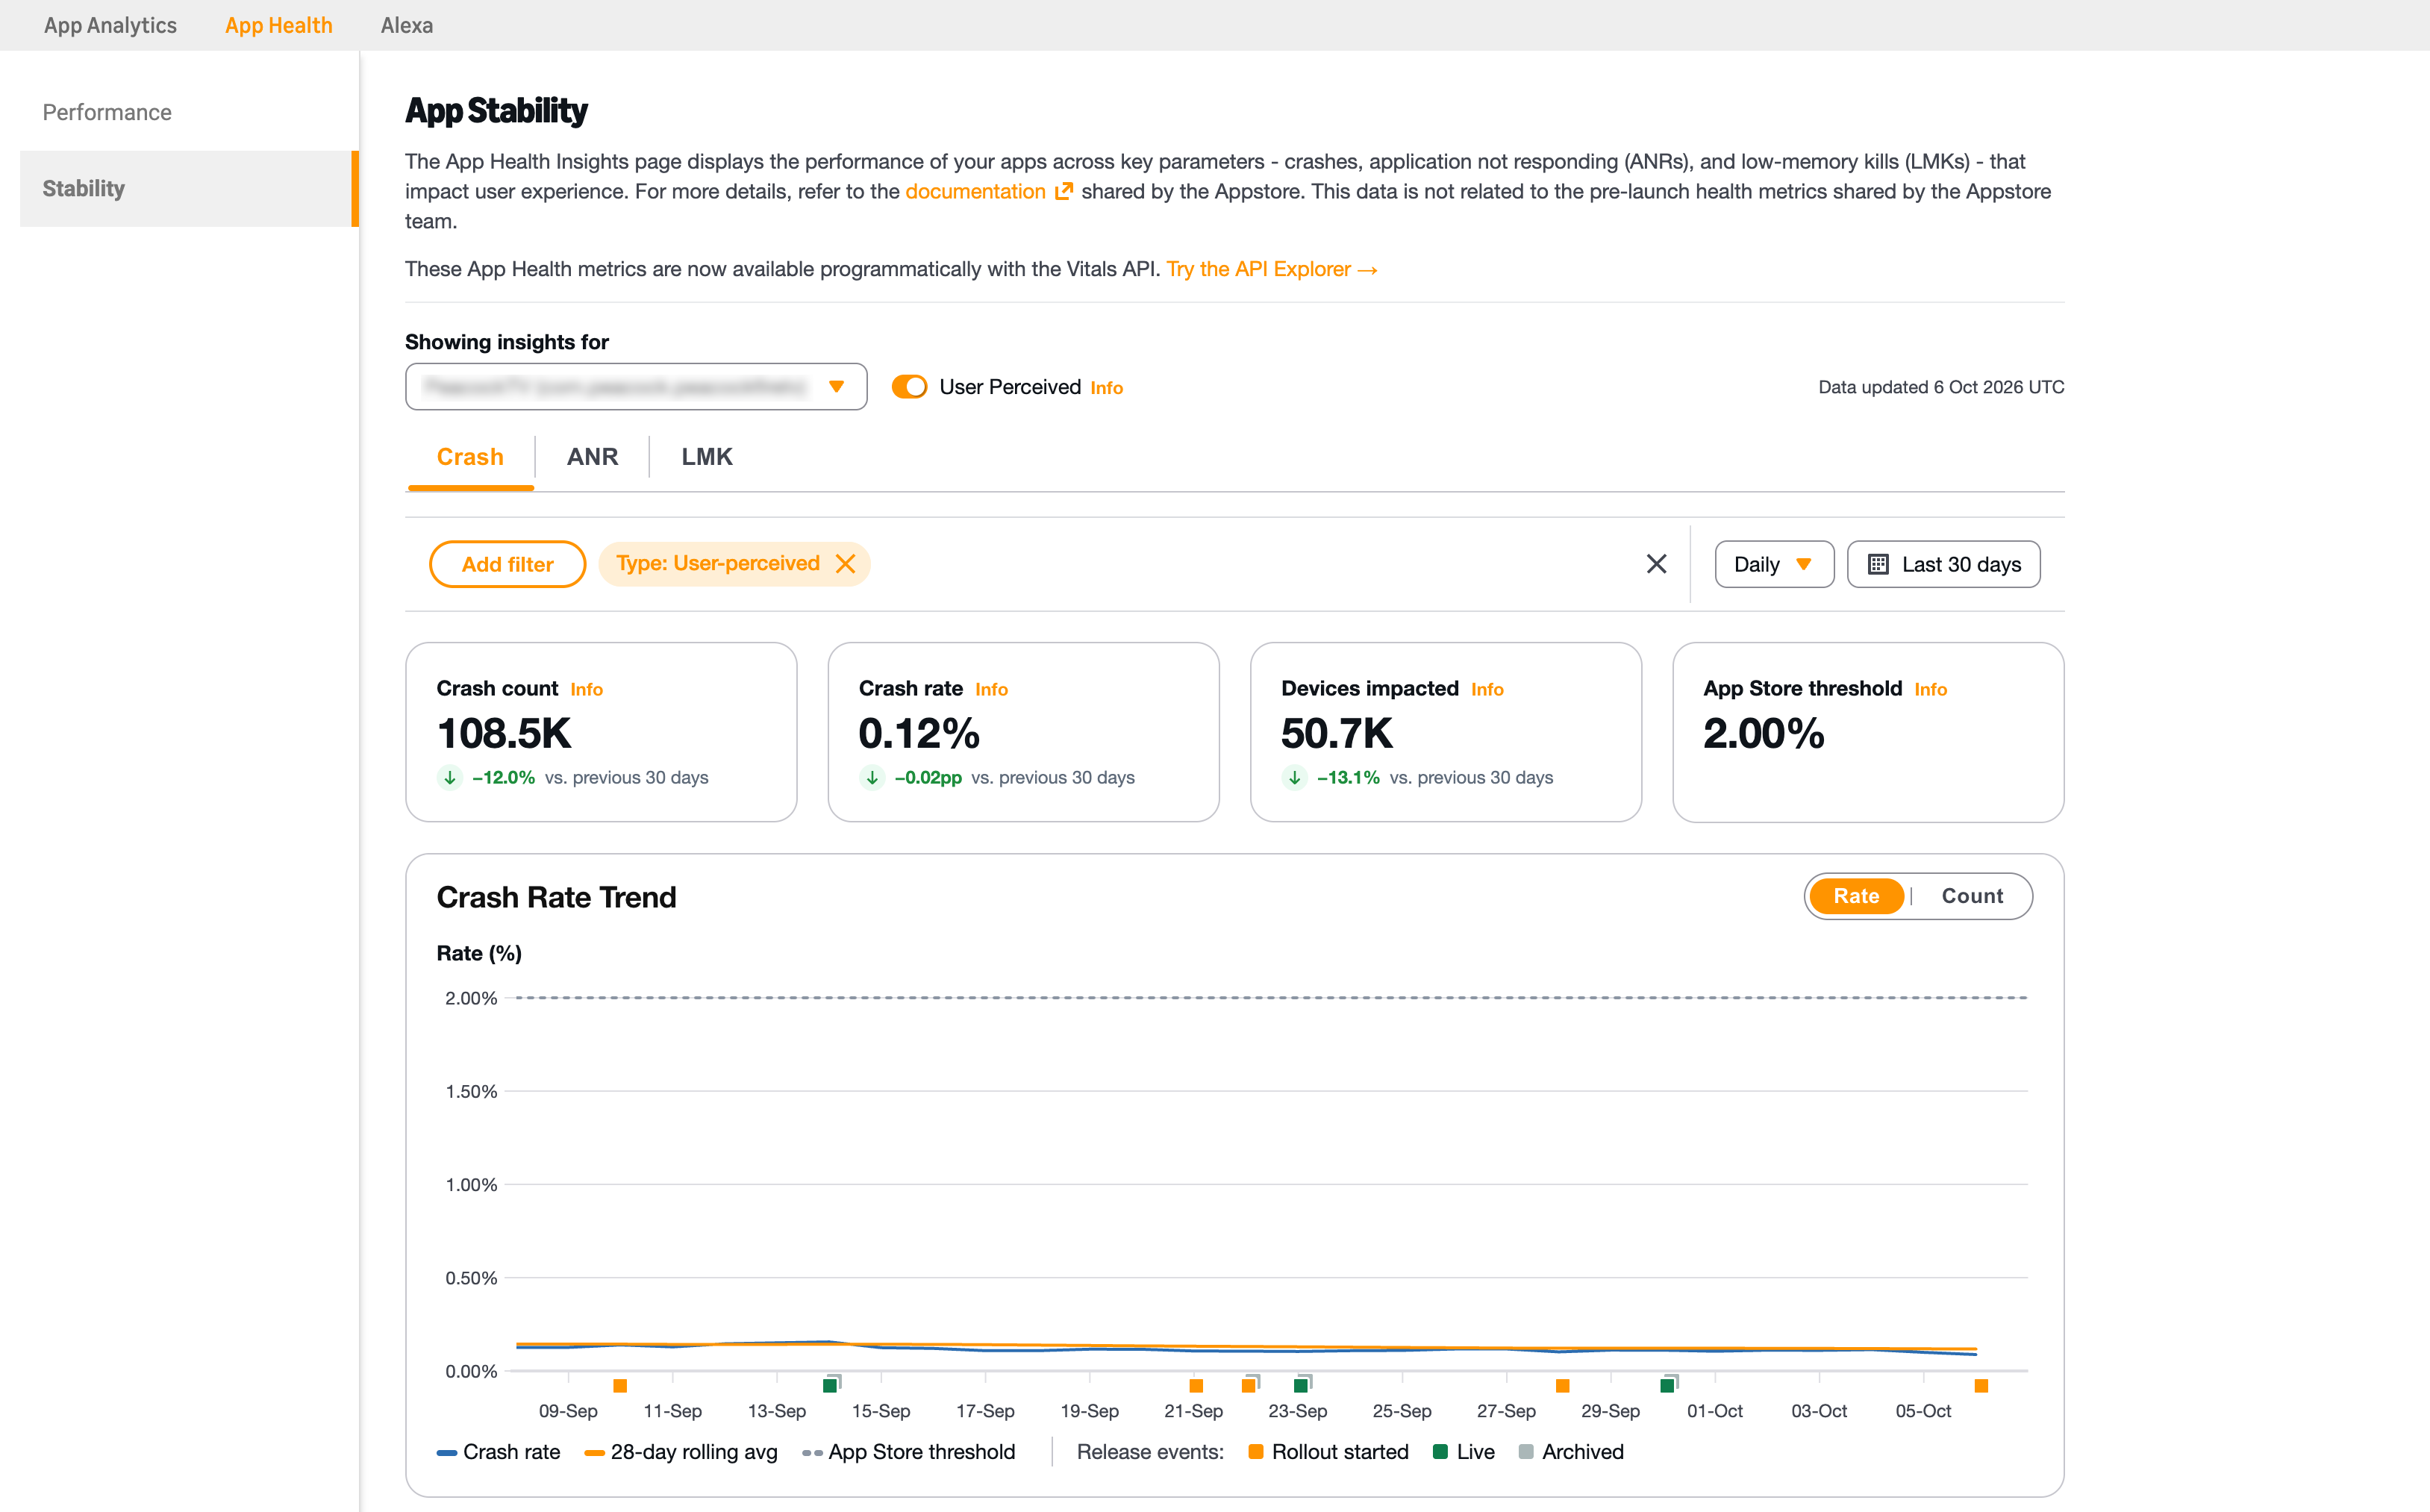
Crash Rate Trend on the Stability dashboard
- App: Select the app to view.
- Aggregation: Select Daily or Hourly.
- Time range: Select a preset or custom range. For more details, see Time range.
- User Perceived: To include only events that occurred while your app was in the foreground, turn on this setting. By default, it’s on.
Stability KPIs
The following tables describe the KPIs on each tab. To refine a KPI, apply filters such as app version, device, OS, or country. For details, see Manage filters.Crash
| KPI | Description | Additional information |
|---|---|---|
| Crash rate | The average of the daily crash rates for the selected time range. Each daily crash rate is the percentage of that day’s active devices that recorded at least one crash. | Every day carries equal weight, regardless of how many devices were active that day. In hourly view, the dashboard averages hourly rates instead. A device counts as active on a day when it recorded at least one app launch that day. Note: Active devices exclude certain use cases, such as users who opted out of data collection and Kids profiles. For details, see App Stability FAQ. |
| Crash counts | The total number of crash events recorded across all active devices for the selected time range. | Includes both foreground and background events, unless User Perceived is on. |
| Devices impacted | The number of devices that recorded at least one crash. | For details, see Devices impacted. |
| Appstore threshold | The maximum recommended crash rate: 2%. | Keep your app’s crash rate below this threshold. The rate trend graph shows the threshold as a dashed line. |
ANR
| KPI | Description | Additional information |
|---|---|---|
| ANR rate | The average of the daily ANR rates for the selected time range. Each daily ANR rate is the percentage of that day’s active devices that recorded at least one ANR event. | Every day carries equal weight, regardless of how many devices were active that day. In hourly view, the dashboard averages hourly rates instead. Note: Active devices exclude certain use cases, such as users who opted out of data collection and Kids profiles. |
| ANR count | The total number of ANR events recorded across all active devices for the selected time range. | Includes both foreground and background events, unless User Perceived is on. |
| Devices impacted | The number of devices that recorded at least one ANR event. | For details, see Devices impacted. |
| Appstore threshold | The maximum recommended ANR rate: 0.47%. | Keep your app’s ANR rate below this threshold. The rate trend graph shows the threshold as a dashed line. |
LMK
| KPI | Description | Additional information |
|---|---|---|
| LMK events | The total number of low-memory kills recorded across all active devices for the selected time range. | Includes both foreground and background events, unless User Perceived is on. |
| LMK rate | The average of the daily LMK rates for the selected time range. Each daily LMK rate is the percentage of that day’s active devices that recorded at least one low-memory kill. | Every day carries equal weight, regardless of how many devices were active that day. In hourly view, the dashboard averages hourly rates instead. |
| Avg events per day / Avg events per hour | The total number of LMK events, divided by the number of complete days or hours in the selected time range. | — |
| Devices impacted | The number of devices that recorded at least one low-memory kill. | For details, see Devices impacted. |
Devices impacted
On each tab, Devices impacted counts the devices that recorded at least one event each day. It then adds the daily counts for the selected time range. A device that recorded events on three different days counts three times. As a result, this value is a total of device-days, not a count of distinct devices. On the issue detail page, Devices impacted uses the same calculation as the main KPI tables. For details, see Issue detail page.Comparison with the previous time range
Each KPI card compares its value with the previous time range of the same length, for example, vs. previous 30 days. An increase appears in red, and a decrease appears in green. The comparison appears only when enough historical data is available.Trend graphs
Each tab includes a trend graph for the selected time range. To switch between views, select Rate or Counts.- Rate: Shows the daily or hourly rate and a rolling average weighted by device count (28 days for daily view, 7 days for hourly view). On the Crash and ANR tabs, it also shows the Appstore threshold as a dashed line.
- Counts: Shows the number of events and devices impacted for each day or hour.
Release markers
Release markers show when production releases of your app reached users, so you can check whether a change in the graph coincides with a release. Each marker is a small square below the date axis.
| Marker color | Event | Meaning |
|---|---|---|
| Orange | Rollout started | A staged rollout began, and the first users started to receive the release. |
| Green | Live | The release became available to all users. |
| Gray | Archived | The release was archived and is no longer the current release, for example because a newer release replaced it. |
- Hover your mouse over a marker. A card shows the date, in UTC, and each release event for that day. For each event, the card lists the number of app versions in the release, with the version code and version name of each one.
- To keep the card open, select the marker.
- To view metrics for only the app versions in a release, in the open card, select Filter next to that release.
- To close the card, select the marker again, select the close icon, or press Esc.
Breakdowns
Each tab includes a Breakdown section, which splits the current metric by one of the following dimensions:- App version
- Device model
- OS version
- Form factor
- Country / region
- To search all segments and select more than one, select View all.
- To filter the dashboard to a segment, select the filter action in that segment’s row.
Issues
The Crash and ANR tabs list your app’s individual issues. For each issue, the list shows a summary of the issue, the number of devices impacted, the number of events, and the time it last occurred. You can sort the list by Devices impacted, Events, and Last occurred. You can export the list as a CSV file. To view details for an issue, select it in the list.Issue detail page
The issue detail page shows metrics for a single issue. It keeps the app version, device, OS, country, time range, and aggregation that you set on the tab. To narrow the results, you can apply more filters. To return to the list, select Back to all issues. The page has the following sections:- Issue summary: Shows the issue type (Crash or ANR), the top frame of the stack trace, and the crash descriptor, which you can copy. Four KPI cards show Events, Devices impacted, Issue rate, and Last occurred. Each card (with the exception of Last occurred) compares its value with the previous time range. The Most affected version card shows the app version with the most devices impacted by the issue. To include only foreground events in every metric on the page, turn on User Perceived.
- Trend graph: Shows the issue’s rate or count for the selected time range. It includes the same views and release markers as the tab graphs.
- Breakdown: Splits the issue by app version, device model, OS version, form factor, and country or region. For each segment, the table shows its events, devices impacted, share of the issue, and share of devices. The Visibility tab compares foreground events with all events. To filter the whole page to a segment, select its row.
- Stack trace: Shows the complete stack trace. To copy it, select Copy trace.
Managing filters
When you change a filter, the KPIs, trend graphs, breakdowns, and issues on the dashboard update automatically.Time range
| Aggregation | Preset ranges | Default range | Maximum custom range |
|---|---|---|---|
| Daily | Last 7 days, last 14 days, last 30 days | Last 30 days | 30 days |
| Hourly | Last 1 day, last 3 days, last 7 days, last 15 days | Last 15 days | 15 days |
Dimension filters
To filter the dashboard by a dimension, select Add filter, select a dimension, and then select one or more values. Each applied filter appears as a chip. To change a filter, select its chip. To remove a filter, close its chip.| Filter | Description |
|---|---|
| App version | The versions of your app that have data within a fixed recent window. Each version shows its version name and version code, for example, 2.4.1 (204010). Versions that are currently live show a LIVE badge. To select every live version at once, select All live versions. |
| Device type | The device families that use your app, such as Fire TV and Fire tablets. |
| Device model | The individual device models that use your app. |
| Device OS | The operating systems that run your app, such as Fire OS and Vega OS. |
| OS version | The operating system versions that run your app. |
| Country / region | The countries and regions where your app is used. |
