
Chrome DevToolsを使用したアプリのプロファイリング
Vega向けReact Nativeは、Fire TV対応アプリのデバッグとプロファイリング用にChrome DevTools(CDT)をサポートしています。CPUパフォーマンス、メモリ使用量、ネットワークアクティビティを分析するには、CDTを使用します。CDTはChromeブラウザに搭載されており、開発者はこれを使用してアプリの検査、デバッグ、プロファイリングを行うことができます。CDTの基本については、React Nativeのデバッグに関するドキュメント(英語のみ)を参照してください。
このページでは、Vega仮想デバイスとFire TV Stickの両方を対象に、Vega StudioでCDTデバッグを設定する方法について説明します。
Vega向けReact Nativeアプリの実行
デバッグを開始するには、次の手順に従います。
-
Vega Studioでコマンドパレットを開きます。
Mac:
Shift+Command ⌘+PLinux:
Ctrl+Shift+P -
コマンドパレットで「Vega App: Run the current Vega app」と入力します。
このコマンドによって以下が実行されます。
- Metroパッケージャー(React Native用のJavaScriptバンドラー)の起動
- デバイスとホストコンピューター間のポートフォワーディングの設定
- デバイスでアプリを起動
CDTの起動
Vega Studioから、統合されたデバッグエクスペリエンスを使用してCDTを起動します。以下の手順を完了します。
- Vegaデバイスを開発用コンピューターに接続します。
- Visual Studio Code(VS Code)で、[Vega Studio] パネルに移動します。
- [Vega] セクションで、プロジェクトを選択します。
-
[Build Modes]セクションで、[Debug] を選択します。注: React Native用CDTはデバッグビルドでのみ動作します。 -
[Devices] セクションで、Fire TV StickデバイスまたはVega仮想デバイスを選択します。
-
デバッグ用にアプリを実行します。
a. Vega向けReact Nativeアプリの実行の手順に従います。
b. アプリが正常に実行されるのを待ちます。
c. React Native Packagerが接続されていることを確認します。
パッケージャーが接続されていない場合は、もう一度コマンドパレットから「Vega App: Run the current Vega app」を実行してMetroを再起動します。
d. VS Codeの [出力] ウィンドウに移動します。
e. ドロップダウンリストから [React Native] を選択します。
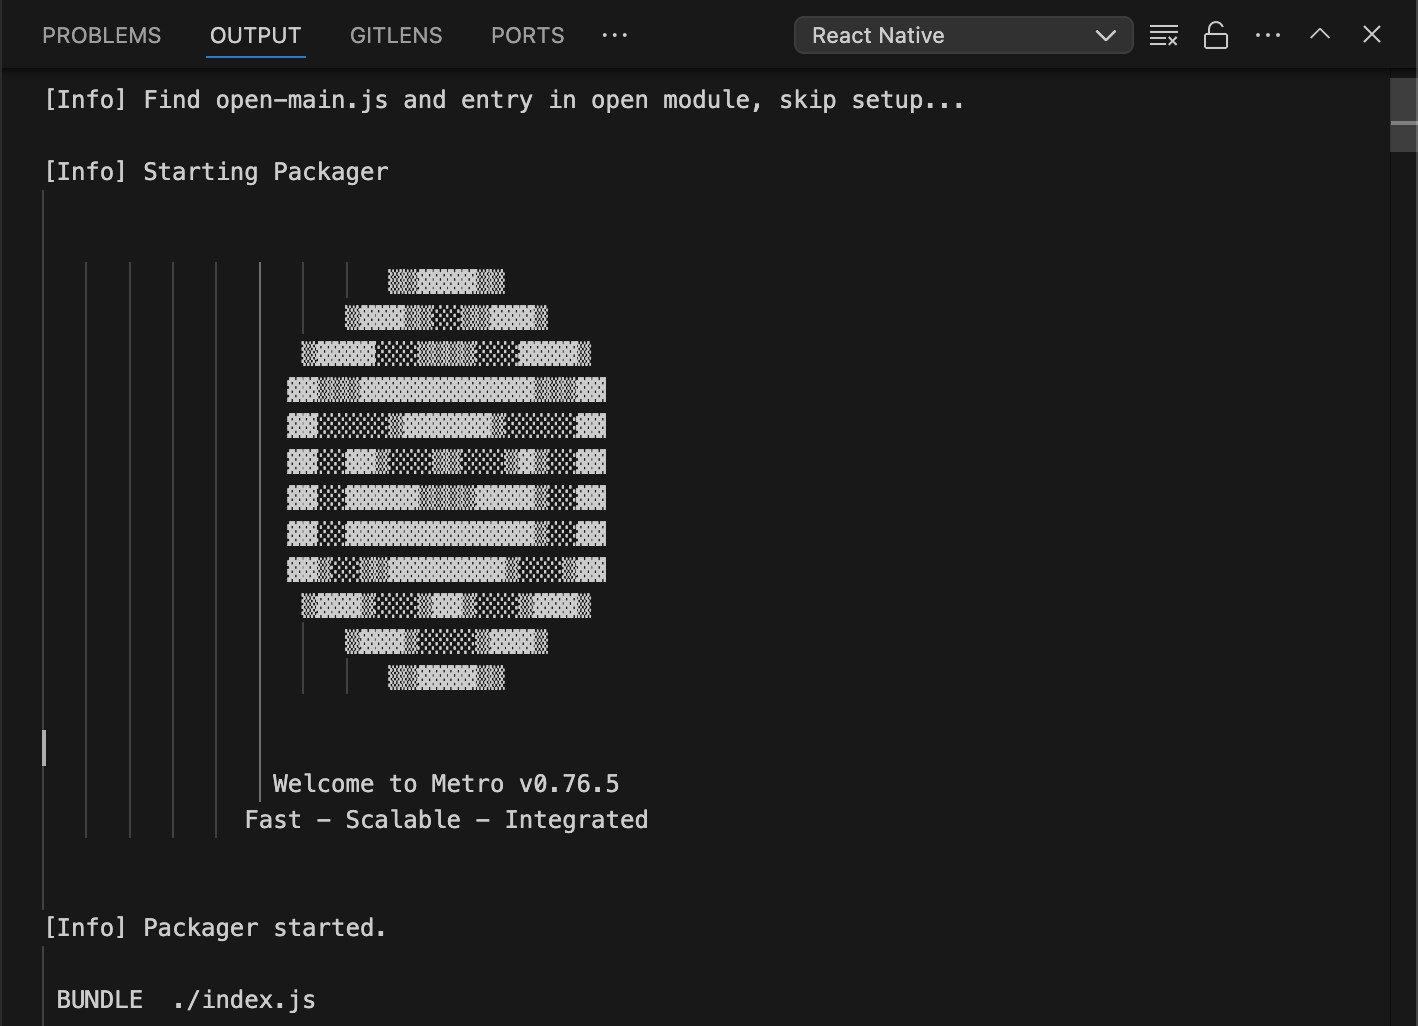
-
CDTを起動します。
a. コマンドパレットを開きます。
Mac:
Shift+Command ⌘+PLinux:
Ctrl+Shift+Pb. 「Vega: Launch Dev Tools」と入力し、Macの場合はreturnキー、Linuxの場合はEnterキーを押します。
![[App Performance Tools] からCDTを起動する画面を示すスクリーンショット。](https://m.media-amazon.com/images/G/01/mobile-apps/dex/vega/chrome-devtools/app-performance._TTH_.png)
[Vega Studio] > [App Performance Tools] から [Chrome Dev Tools] を選択することもできます。
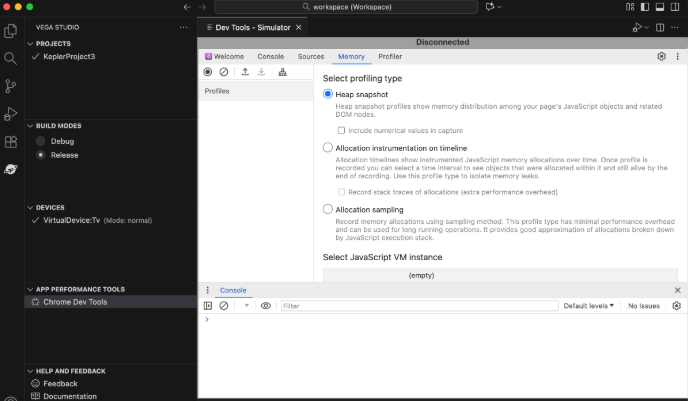
-
CDTを起動すると、新しいウィンドウに進行状況バーが表示されます。読み込みが完了すると、同じウィンドウでCDTが開きます。[Sources] タブと [Console] タブがアクティブになり、左側のパネルにアプリのJavaScriptファイルが表示されます。
CDTからデバイス上のアプリに接続できない場合、ウィンドウの上部に [Disconnected] と表示されます。
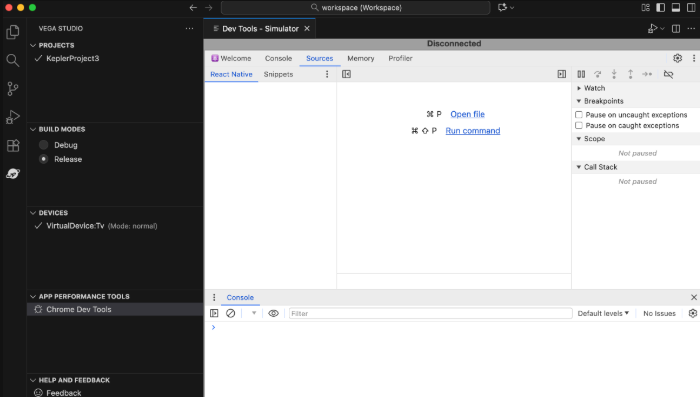
スプラッシュスクリーンの表示、アプリの再起動、またはその他の理由でCDTが切断された場合は、Vega Studioの [Dev Tools] タブを閉じます。次に、CDTの起動の手順に従って再接続します。
![[App Performance Tools] からCDTを起動する画面を示すスクリーンショット。](https://m.media-amazon.com/images/G/01/mobile-apps/dex/vega/chrome-devtools/app-performance.png)
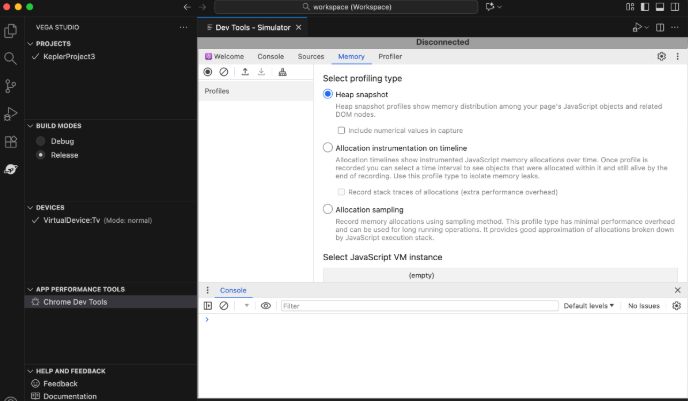
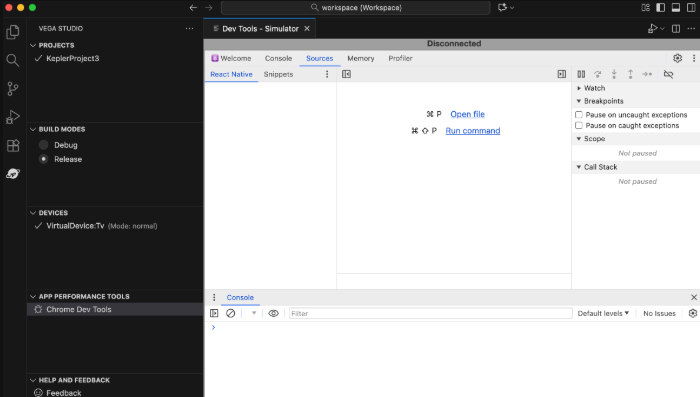
ブレークポイントまたは行単位のデバッグの設定
ブレークポイントは、デバッガーが実行を一時停止するコード内の指定されたポイントで、これによりプログラムの状態を調べることができます。ブレークポイントの詳細については、Chrome for Developersの記事を参照してください。
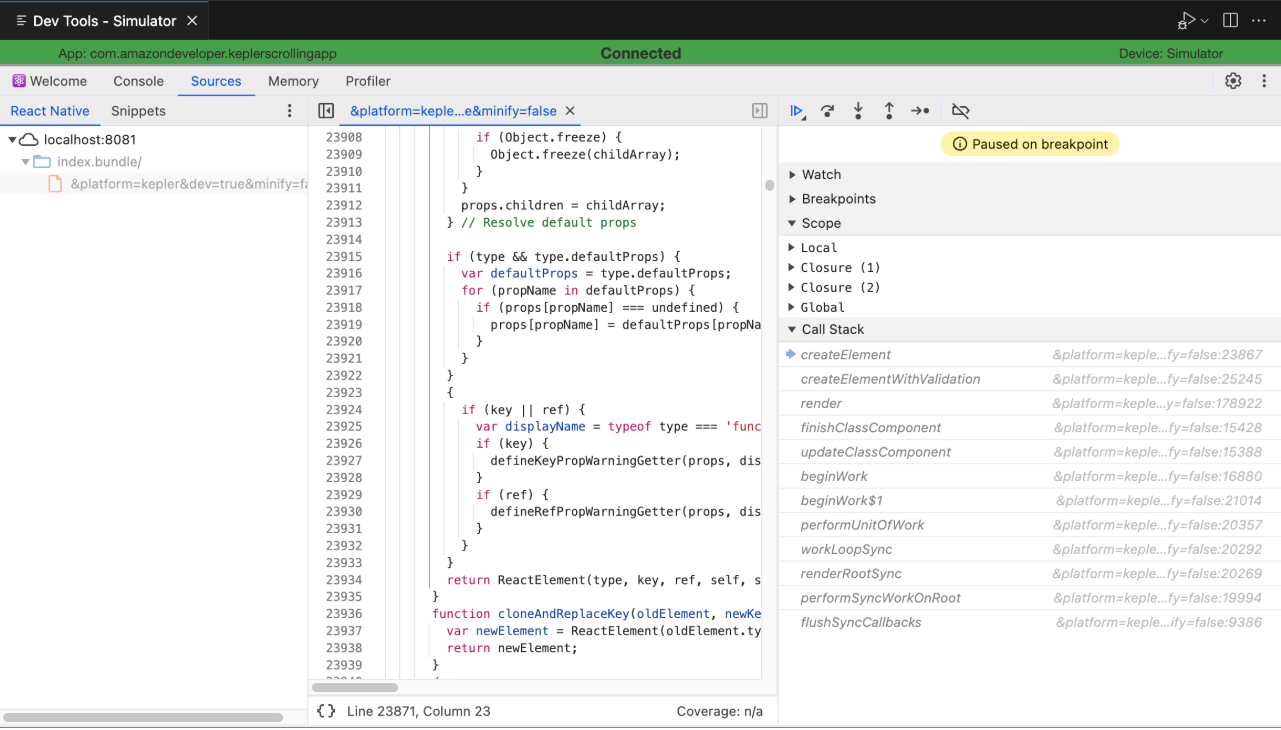
-
[Sources] タブで、[localhost:8081] > [index.bundle/] の順に展開し、
&platform=kepler&dev=true&minify=falseファイルを開きます。デバッグする関数または行を検索し、行番号を選択してブレークポイントを設定します。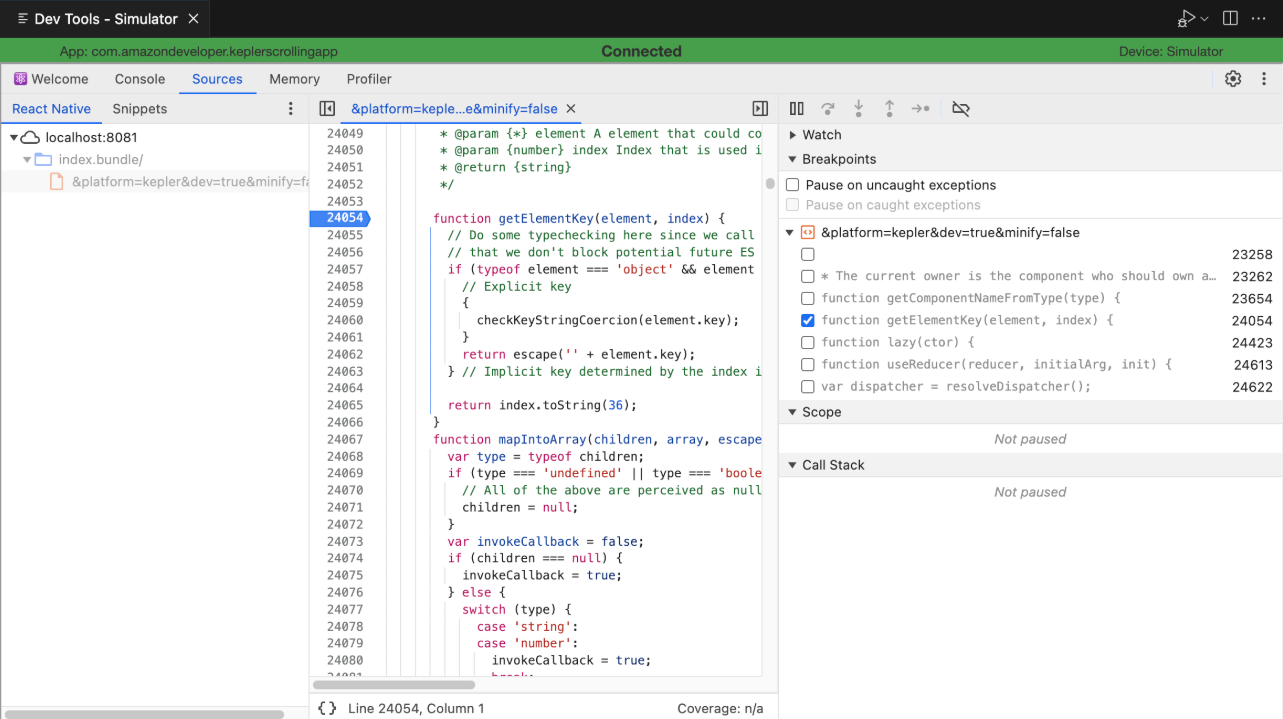
-
アプリでコードを実行します。デバッガーがブレークポイントに達すると、実行が一時停止されます。
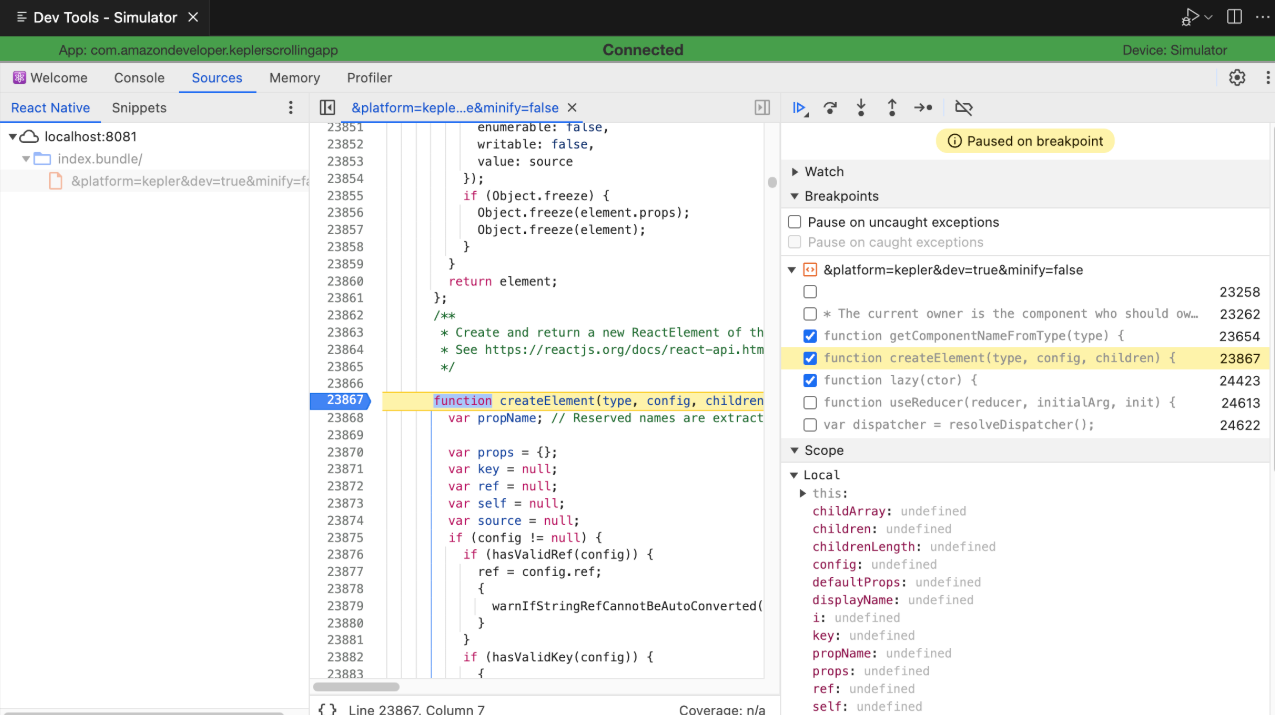
-
変数を検査するか、通常どおりプログラムの実行を制御します。
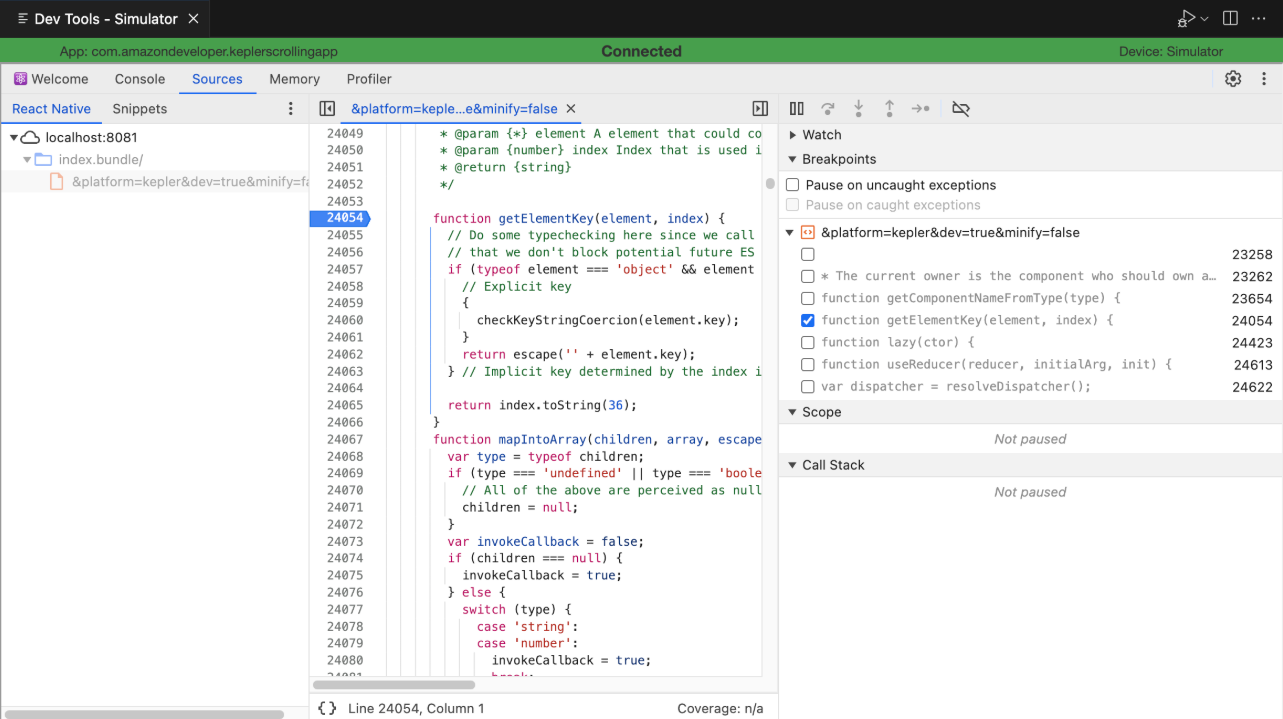
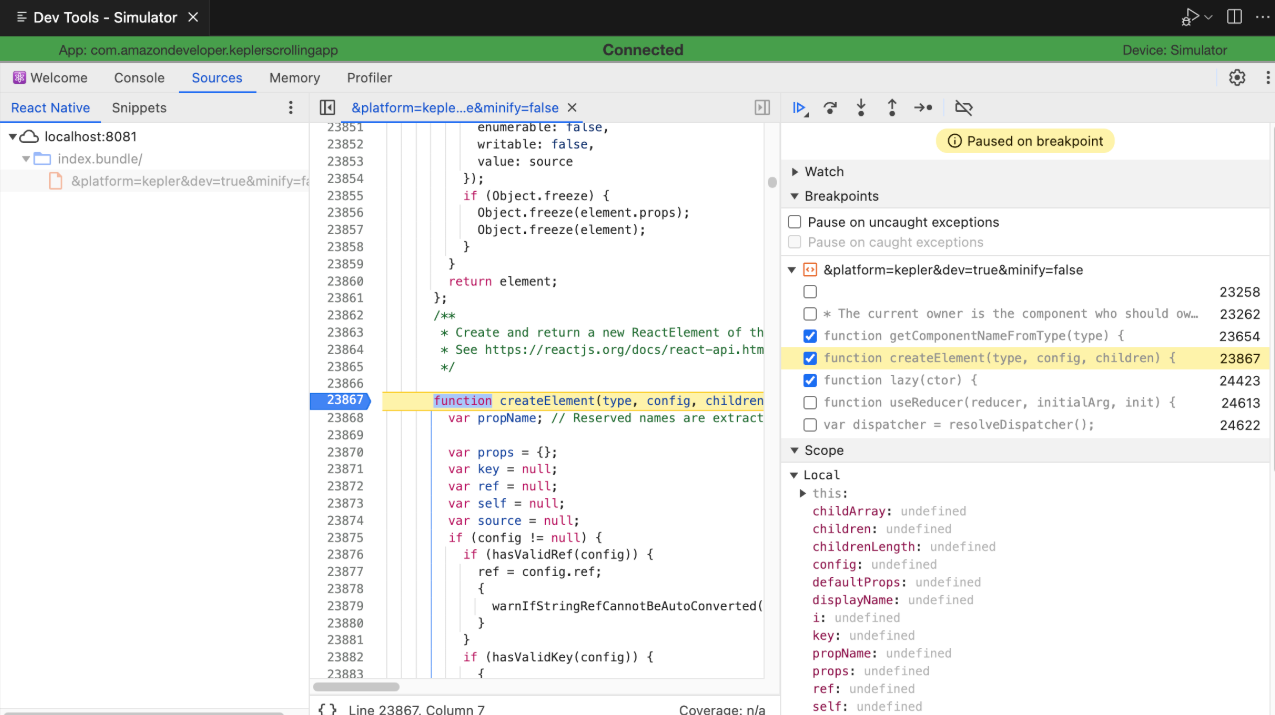
アプリのパフォーマンスのプロファイリング
CDTを設定したら、[Performance] タブを使用してCPUプロファイルを記録したり、[Memory] タブを使用してヒープスナップショットをキャプチャしたりできます。結果の解釈に関するガイダンスについては、アプリのパフォーマンスに関するベストプラクティスとアプリのKPIの測定を参照してください。
FlipperとCDTのサポート
React Nativeチームによると(英語のみ)、React Native 0.74以降ではFlipperのサポートが終了します。CDTでのソースマップのサポートは、React Native 0.73で完全に機能するようになっています。このサポートは、Vega向けReact NativeをReact Native 0.73にアップデートすると利用可能になります。
関連トピック
Last updated: 2026年7月10日
